With the world now completely reliant on oil and gas, planned breaks in production are a necessary part of the refining process. Luckily the historical cost data is a big help in creating cost estimates in all preparation stages.
The oil and gas industry is not new to a changing landscape. Several refineries in Europe were built in the 2-3 decades following world war 2, possess a limited range in feedstock and product portfolio. Several refineries have either closed down or focused on maintaining a stable utilization of around 80% using continuous operational optimization conducted during their Turnarounds.
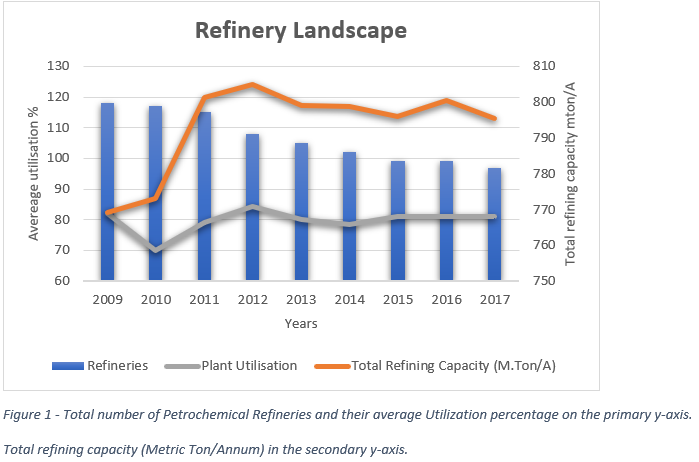
These turnarounds can be due to a need for maintaining, renovating, or refitting facilities every four years or so. Turnaround activities require well-organized labour and equipment for a few weeks at a time, the duration of which is usually measured in shifts. Most facilities will be inspected during shutdowns and turnarounds.
Turnaround cost estimates based on historical data
Turnarounds ensure that the facility can adapt to the changing demands of the market while profitably operating its existing assets. This incentivizes companies to make an accurate cost estimate at a very early stage of the process. During the initiation phase, a multidisciplinary TA planning team is appointed to carry out a preliminary financial assessment to set expectations within the business.
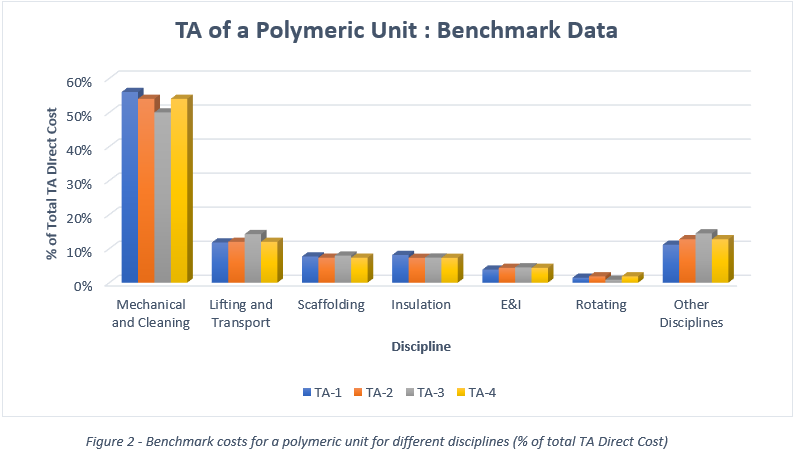
A ±50% estimate referred to an as rough order of magnitude (ROM) estimate prepared using the cost of the last turnaround, adjusted for inflation. A ROM estimate requires limited effort and is supported by benchmarks for the unit/site based on historical data. An example is shown in the chart below, where the % of total TA costs for different disciplines of a polymeric unit is presented from historical data.
Subsequently, the business will request a budget estimate (typically ±30% accuracy) for authorization.
A ±30% estimate will provide granularity on the following cost elements
– The breakup of capital vs maintenance projects
– Direct cost vs Indirect cost vs Allocations for contingency
– Labor, material and rental costs
– Production losses if requested by the business
A budget estimate heavily relies on historical data, actualized to the current context (scope, turnaround objective, etc.) since no two turnarounds have the same target.
Evaluation of contractor bids
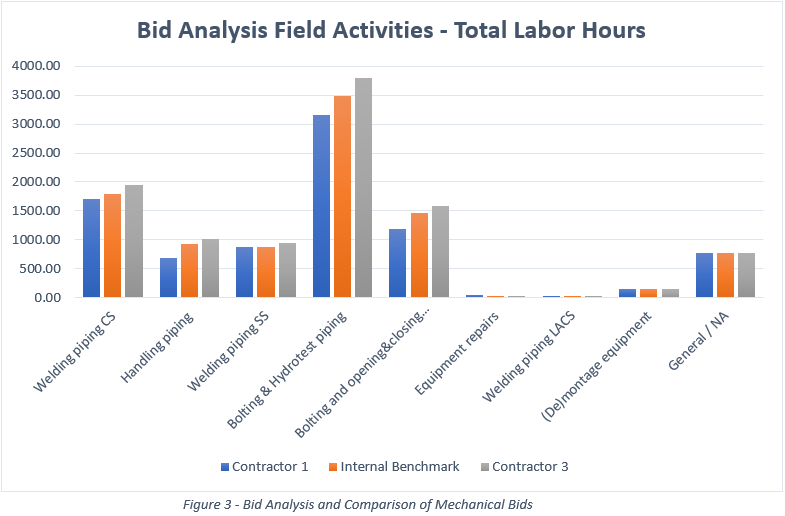
After the budget is approved, the cost engineer incorporates the contractor bids to complete the control estimate (typically ±10% accuracy) against which the financial performance of the turnaround will be measured. With reliable internal benchmarks, the contractor bids can be objectively evaluated and challenged on a granular level, as shown in an example below.
Conclusion
At every stage of estimate preparation, the cost engineer can rely on unit/site-specific data to improve the accuracy of the cost estimate, which would support the business towards reaching the goals of a turnaround.
Sources
· Concawe, “Environmental Science for European Refining,” 2018. [Online]. Available: https://www.concawe.eu/refineries-map/.
· Reuters, “Europe faces new wave of oil refinery extinctions,” 2013. [Online]. Available: https://www.reuters.com/article/europe-refinery/europe-faces-new-wave-of-oil-refinery-extinctions-idUSL6N0I638T20131016.
· Mckinsey, “Capturing Margin Opportunities in Oil and Gas Refining,” 2015.
· N. Gordon Lawrence, “Cost Estimating for Turnarounds,” Digital Refining, January 2012.
Turnaround Estimating & Budgeting
Cleopatra Enterprise Software
Define your budget accurately with Cleopatra Enterprise to predict cost, time, and resources. Form the basis of project control.
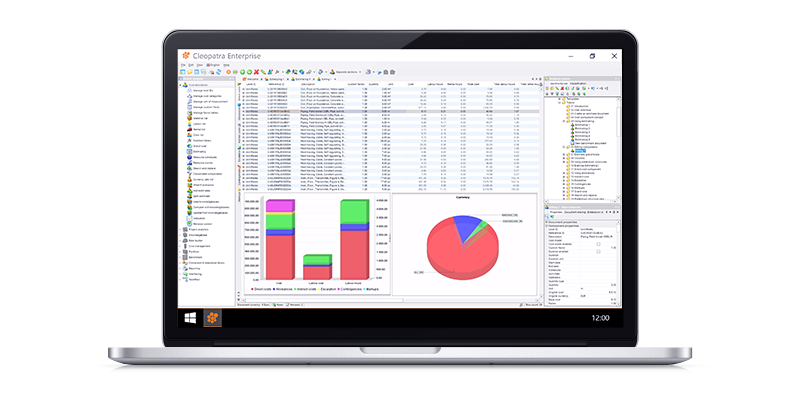
Turnaround Cost Database
Cleopatra Enterprise Software
Maintain a solid basis for your turnaround with the comprehensive turnaround cost database in Cleopatra Enterprise.
